FPGA+DSP-based Shockwave Overpressure Test System Design and Implementation - System Testing (Part 2)
5 System Function Testing and Simulation
After completing the design of the system hardware circuit board and the development of software programs, this chapter separately tested the read/write waveforms of the A/D acquisition module and the DDR3 SDRAM storage module. Packet capture and speed testing were also performed on the Gigabit Ethernet transmission module using Wireshark software. After successful debugging and verification, the modules were assembled for overall system testing to check if the system functions meet the requirements. The assembly diagram of the data acquisition system is shown in Figure 5-1. From top to bottom, they are the AD9238 analog-to-digital conversion module, FPGA module, Gigabit Ethernet module, and DSP module. Module expansion can be performed later according to experimental requirements.
After verifying the DC performance of the A/D module, the output interface of the Agilent signal generator was connected to the SMA interface of A/D module channel 1. A sine wave signal with a peak-to-peak value of 4V (-2V~+2V) and a frequency of 500KHz was sent. The FPGA controlled the AD9238 to acquire the signal at a speed of 65 MS/s. The settings for the signal under test at the signal generator are shown in Figure 5-2.
Figure 5-3 shows the acquisition results from A/D module channel 1 when the signal generator transmitted a 500KHz sine wave.

5.4 Overall System Testing
After the design of the shockwave overpressure test system was completed, overall testing was conducted to comprehensively evaluate its performance. Due to the complex nature of shockwave testing environments, this paper chose to measure shockwave signals in a static environment to verify system feasibility. This was done by using a signal generator to produce the static detonation shockwave waveform of a certain type of projectile (obtained through experiments), and then using the designed system for signal acquisition. This testing method facilitates repeatable experiments to verify system reliability and has low economic cost.
To obtain the shockwave waveform during the explosion of a certain type of projectile, field tests were conducted, and accurate signal waveforms were acquired using a transient signal acquisition instrument. A brief description of this experiment is provided below. Figure 5-12 shows the equipment layout diagram of the test site. There were 10 measurement points in the experiment. The ammunition was placed on a central stand, with the projection of the ammunition serving as the blast center. Measurement points were arranged in four radial directions at angles of 30°, 45°, 60°, and 90°. The test radii were 1m, 2m, and 5m, respectively. The selected 120B15 and 102B16 series sensors were fixed by clamps at the top of the stands in a fan-shaped distribution. Figure 5-13 shows the experimental site.
As can be seen from the figures, the measured data curves have few glitches. The rising edge of the curve is steep, and the overpressure peak is high (approximately 1.65 MPa). The positive pressure duration is short, the negative pressure is low, and the pressure decay process exhibits exponential decay. These are clear characteristics of a shockwave signal, verifying the performance of the selected sensors. Correct test results can be obtained by using this type of sensor.
(1) Test Preparation Phase:
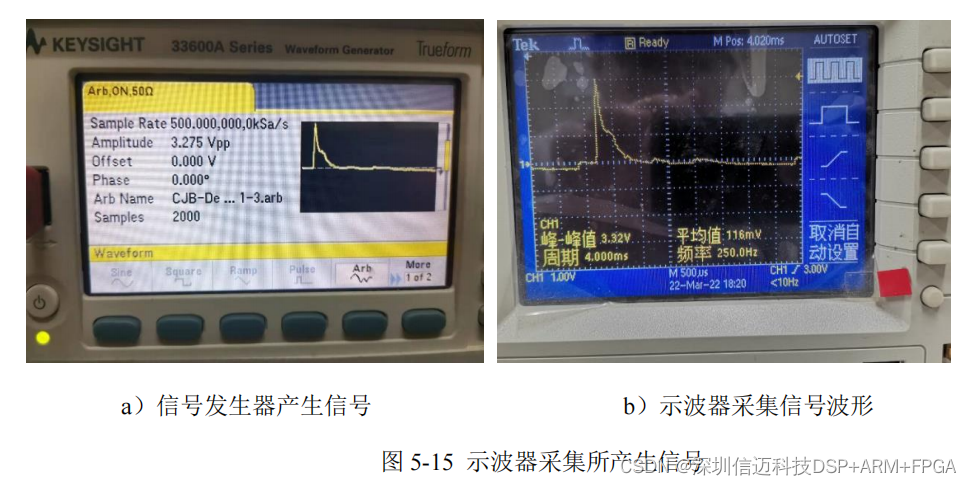
To verify the operational stability and reliability of the test system, the acquired shockwave data was exported to the host computer. Each sampled data point was converted into a voltage value and input to the signal generator, allowing the signal generator to produce a shockwave signal, which facilitates repeatable testing of the system. Figure 5-15 shows the shockwave signal generated by the signal generator. From the figure, it can be seen that the signal amplitude is 3.275V. The shockwave curve acquired by the oscilloscope is consistent with the waveform output by the signal generator, indicating normal signal generator output.
(2) Test Procedure:
On the premise that all modules can operate normally, the data acquisition system was assembled, and system function tests were performed. After verifying the system was correct, it was powered on. The program was burned into the system via a simulator. The output channel of the signal generator was connected to one channel of the A/D module. Simultaneously, it was connected to the host computer via a Gigabit Ethernet card. The FPGA controlled the A/D module to acquire signals at a speed of 65 MS/s. The oscilloscope software on the host computer was opened to observe the waveform. The acquisition environment is shown in Figure 5-16.
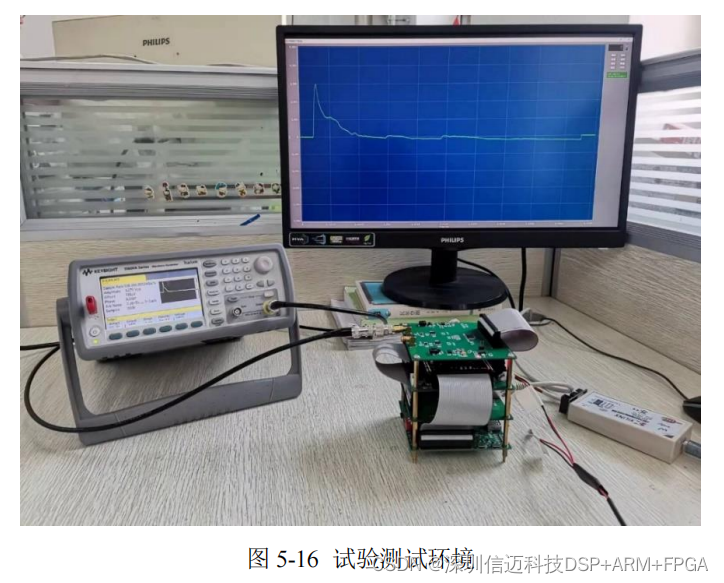
Figure 5-17 shows the acquired shockwave curve. From the figure, it can be seen that the acquired signal has no glitches, the waveform is clear and distinct, and it is consistent with the signal waveform from the signal generator.
Reference Link: